


Introduction
Abstract
As the world continues to face economic challenges resulting from the covid-19 pandemic, supply chain issues, war in Ukraine, oil price fluctuations, environmental sustainability and other pressing concerns. Companies across the world starting mostly in 2022 have been massively cutting jobs and undergoing hiring freezes. Layoffs.fyi a company layoff monitor created by Roger Lee, indicates that around 362,536 employees have been laid off by major companies from 2022 till date, with more than half of that happening just 5 months into 2023.
I decided to conduct an analytics project to find out which companies were the largest employers in the world, in a bid to better understand how many people these companies employed and what impacts, possible job cuts could mean for them.
Data Source
I obtained company employee data on the top companies by employment numbers from companiesmarketcap.com, which hosts a database of the world's largest public companies. The dataset contained 7328 rows for all entries and 6 columns for rank, name, symbol, employee, price and country of origin, for each company.
Procedure
Data Integrity Checks and Modification
Using MS Excel, I cleaned the data, first removing the unnecessary columns and selecting the first 100 rows as I only needed data on the top 100 employers, then checked for missing/empty values and proceeded to add additional information on the industries of the companies and short information notes for the first 10 companies.
Analytics
I did the analytics using Tableau. I opted for a graph with company logos to showcase the employee distribution of the top 10 companies and a treemap to visualize the company and employee distribution per industry sector. This was especially important as it generated a lot of meaningful insights. I also created a table to highlight the countries where these companies were domiciled.
Background Design
I built the background using a combination of different Figma tools, adjusted them to scale and applied it to my Tableau Public environment.
Visualization
Note: An interactive version of this visualization, which gives a better understanding of the dashboard is available on my Tableau Public profile https://public.tableau.com/app/profile/emmanuel.ogebe1/viz/TheWorldsLargestEmployers/Dashboard8, as hashnode does not currently allow visualizations to be embedded.
Major Insights
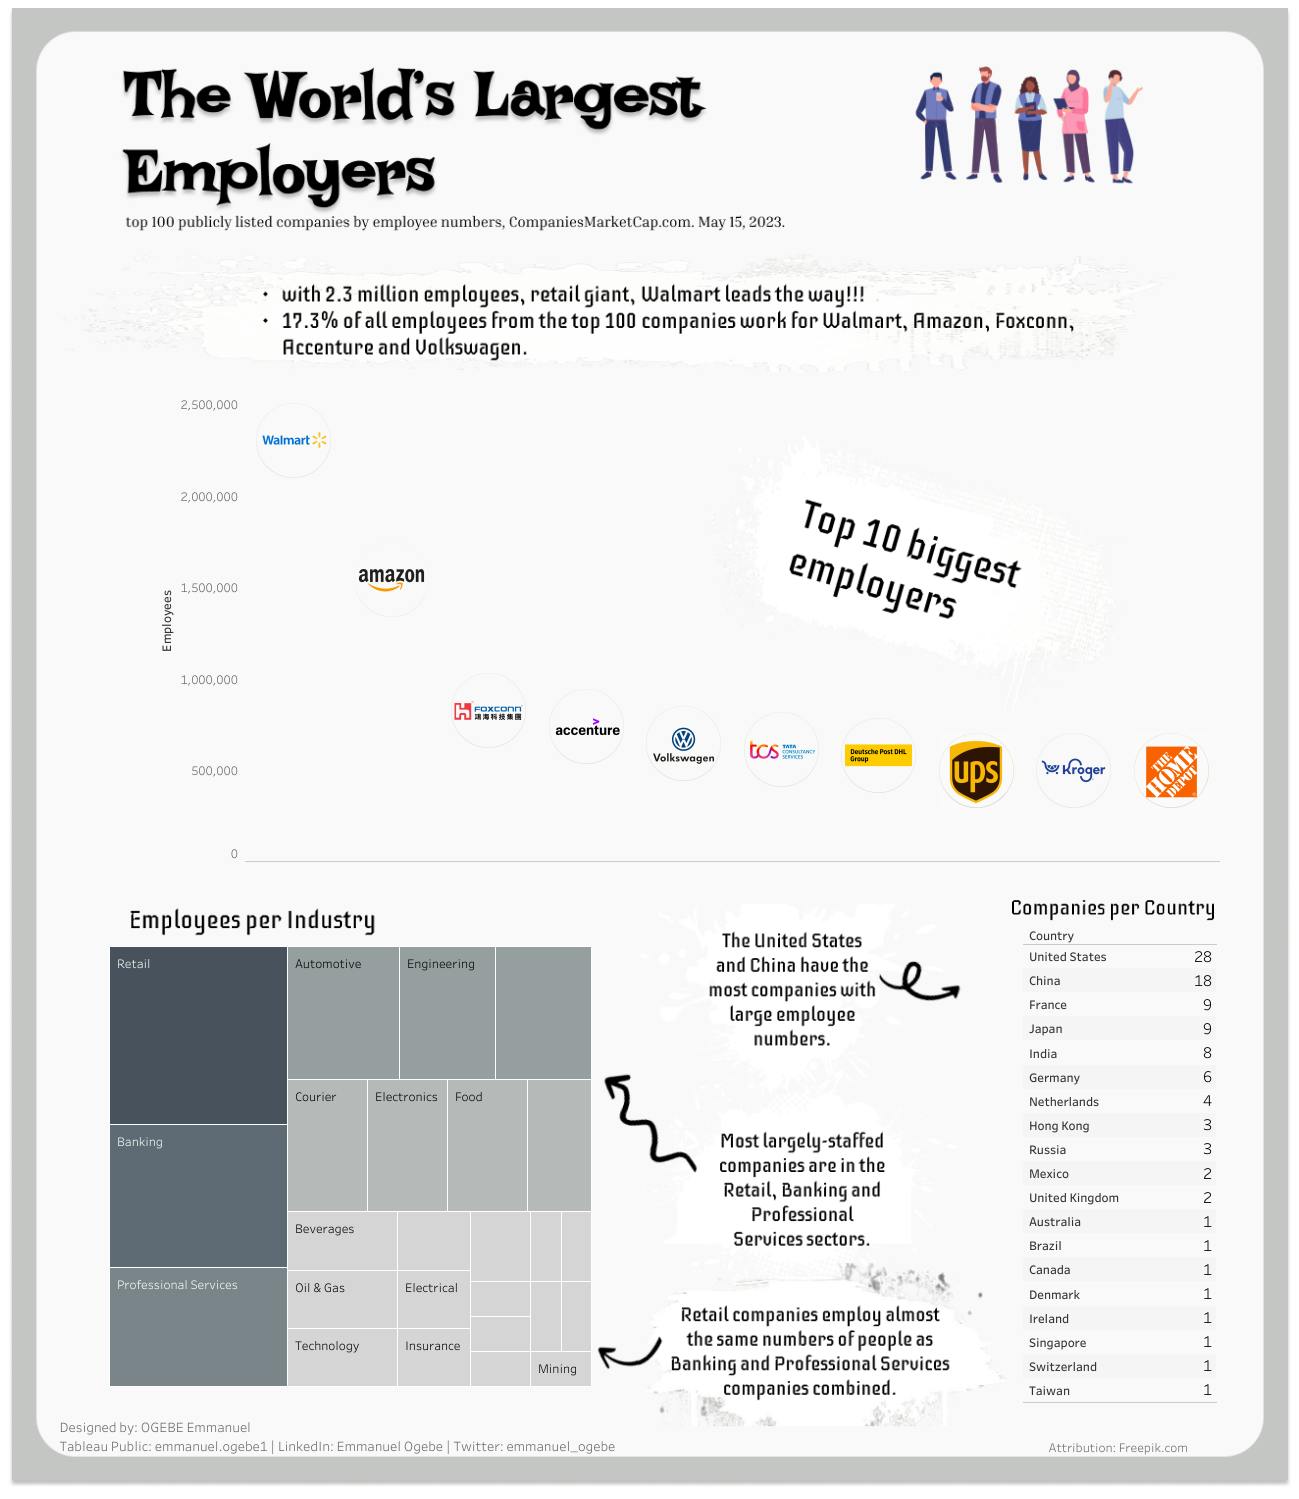
Walmart has 2.3 million employees. This figure is more than the population of around 89 countries and territories across the world.
The top 5 companies, Walmart, Amazon, Foxconn, Accenture and Volkswagen, employ 17.3% of all employees who work for the top 100 companies.
United States and China:
The United States and China have the most companies with large employee numbers.
More people are employed in the retail and professional services industries in the United States as opposed to banking and engineering industries in China.
Surprisingly, despite the constant hype, Technology focused companies Microsoft, Meta Platforms(Facebook) (not amongst the top 100), and Apple, combined do not employ as many people as any of the top 3 retail companies, Walmart, Kroger and Home Depot. Amazon is an outlier due to its highly developed E-Commerce and Retail offerings.
Limitations
Government institutions weren't found in the dataset as they are not publicly traded companies. This posed a challenge for the analysis as reputable sources have indicated that the United States Department of Defense, the People's Liberation Army of China, the Russian Ministry of Defense and the United Kingdom's National Health Service and several others, also have huge workforces. The analysis would have been better implemented with data from these organizations.
Conclusion
As layoffs may continue well into the latter parts of the year, with increasing pressures and poor economic outlooks, this analysis gives an idea of the companies and industries that might have the most impact.
A 10% downsizing by Walmart will lead to job losses of over 230,000, more than half of global job loss figures from 2022 to date.
There will be huge impacts in the United States and China if job cuts by major companies are done in the retail and professional services sectors and banking and engineering sectors respectively.
Layoffs by technology companies can be likened to a drop in the ocean, in relation to other industries.
You can connect with me on LinkedIn and interact with me on Twitter.
Footnotes
Special appreciation to the Tableau User Groups and Tableau Public Ambassador, Kevin Wee, whose Tableau x Figma course guided me on this project.
Attribution: Freepik.com